User guide
Introduction
The user interface of AgileFileViewer is very similar to that used by AgileVariantViewer, with the majority of sequence variant filtering options common to both programs. However, they differ in that AgileVariantViewer is designed to present and filter data from many thousands of sequence variants, whereas AgileFileViewer works at a more granular level to consider each variant in turn. Consequently, AgileFileViewer should be used as the last step in variant analysis, when variants in specific genes or vary small regions need to be considered.
Like AgileVariantViewer, AgileFileViewer allows sequence variants to be filtered by chromosomal position, gene location (e.g. splice site, exon or intron), read depth and minor allele frequencies, as well as by mutation type (substitution or indel) and by likely impact on protein function. Once the initial global filtering has been performed, it is possible to view each sequence variant in turn, observing the allele read depths for the variant and noting the predicted effect of the variant on transcripts(s) and protein(s). As each variant is viewed, it is possible to deselect a variant and then export the remaining sequence variants.
Data used in this guide
The download page contains a link to the ATOH7 sequence variant data, used both in this guide and the Quick user guide with the ATOH7 dataset, describing AgileVariantViewer.
File formats
A description of the file formats for the variant and read depth files used by AgileFileViewer can be found here.
Entering data files
AgileFileViewer requires two files, a genomic annotation file and a sequence variants file, each of which is created by AgileAnnotator. Genomic annotation files contain the sequences and positional information of the coding exons, as described by the Consensus CDS (CCDS) project, and are used in the detection and annotation of sequence variants by AgileAnnotator. It is VERY important that the genomic annotation files used to create and then view sequence variants refer to the same version of the CCDS and genomic reference data.
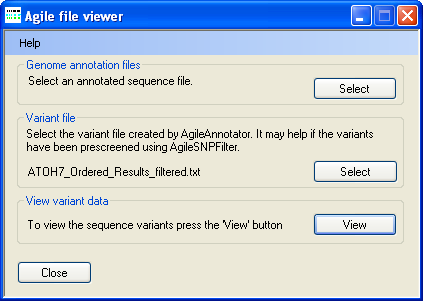
Figure 1: Selecting the data files
To select a genomic annotation file, press in the Genomic annotation file panel (Figure 1) and select the correct file. Since the file is large it may take a few moments to read. Next press in the Variant file panel (Figure 1) and select the file containing the sequence variants identified by AgileAnnotator and ideally filtered by AgileKnownSNPFilter. Once both files have been selected, press the button in the View variant data panel (Figure 1) to display a graphical view of the data (Figure 2).
Viewing the sequence variant data
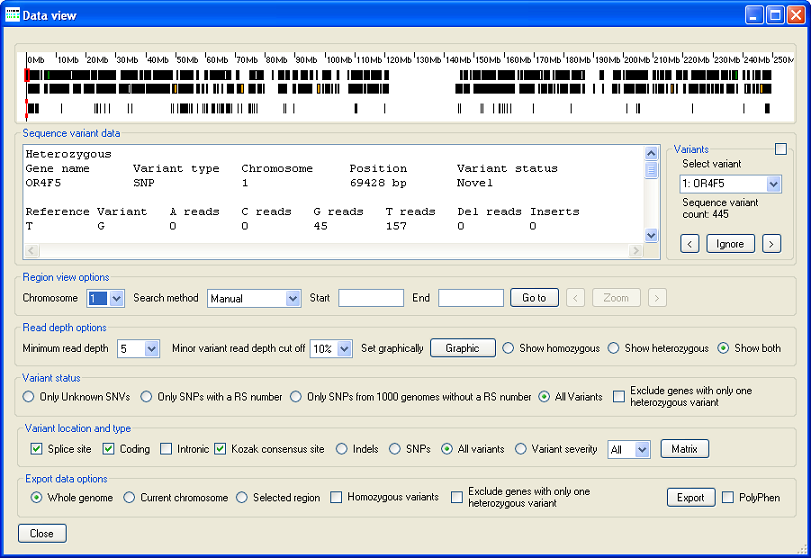
Figure 2: The Data view window displays the variant data.
When the Data view window opens, it displays a graphical view of the sequence variant data on Chromosome 1 in its upper panel (Figure 2). This window is similar to the Data view window displayed by AgileVariantViewer, except that all the sequence variants are displayed on a single panel, and the lower part of the variant display panel is replaced by the Sequence variant data panel, which contains a text description of the currently selected sequence variant. The options in this Data view window also differ slightly from those displayed by AgileVariantViewer The use of these options by AgileFileViewer is described below.
Description of the sequence variant display panel
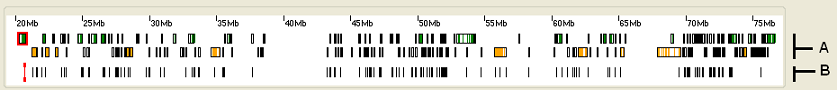
Figure 3: The upper panel displays the sequence variant data organised as a number of horizontal strips. The red line identifies the currently selected sequence variant and the red rectangle highlights the position of the gene that contains the variant.
The upper panel displays the sequence variant data organised as two horizontal strips (Figure 3).
- Strip A: This shows the location of any genes (black rectangles) in the selected region, with the green and orange rectangles representing exons transcribed from
the positive and negative DNA strands respectively.
The red rectangular outline identifies the gene containing the currently selected sequence variant.
Placing the cursor over any gene in this strip causes the gene’s name to appear in the window’s title bar. - Strip B: This shows the location of sequence variants that pass the current filtering options. The red line indicates the location of the currently selected sequence variant.
Selecting a genomic region to view
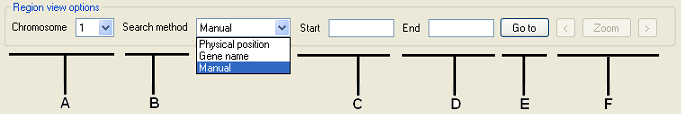
Figure 4: Selecting genomic regions to view is performed using the Region view options panel.
The Region view options panel contains the controls that allow different genomic regions to be viewed (Figure 4). The list (Figure 4, labelled A) is used to select the chromosome to view. A chromosomal region may be selected by entering the region’s coordinates, by entering the gene names of the genes flanking the region, or by mouse-clicking on the graphical view in the upper panel.
- To select a region by entering its coordinates, select the “Physical position” option in the list (Figure 4, labelled B) and enter the basepair coordinates of the region in the and boxes (Figure 4, labelled C and D). Next, press the button; this should place two vertical black lines on the graphical data view, identifying the selected region. Finally, if the selected region is correct, press the button to view the region.
- To select a region using names of the flanking genes, select “Gene name” from the list and enter the names of the genes at the region’s start and end points in the and boxes (Figure 4 C and D). (To view a single gene, enter the same name in both text boxes). Next, press (Figure 4, labelled E); this should place two vertical black lines on the graphical data view, identifying the selected region. Finally, if the selected region is correct, press (Figure 4, labelled F) to view the region.
- To select a region by mouse-clicking on the graphical view panel, select “Manual” under (Figure 4, labelled B), right mouse-click on the graphical view panel at the end of the region, and then left mouse-click at the start of the region. Finally, if the selected region is correct, press the button (Figure 4, labelled F) to view the region.
Pressing the and buttons (Figure 4 F) moves the selected region to the left or right of its current position by 90% of its width, so that 10% of the previous view is retained.
Adjusting the sequence variant filtering parameters
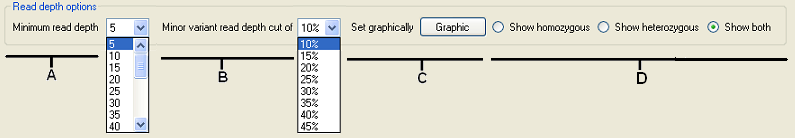
Figure 5: The Read depth options panel interactively filters the sequence variants by read depth and minor allele frequency.
The Read depth options panel allows the sequence variants to be filtered by adjusting the minimum read depth and minor allele cut-off parameters, which are used to genotype a sequence variant. When either of these parameters is altered, the graphical display in the upper panel is updated, allowing the effect of each change to be seen. To adjust the minimum read depth at which a sequence variant is called, select a new value from the list (Figure 5, A), while to change the minor allele frequency cut-off value, select the appropriate value from the list (Figure 5, B). It is also possible to set these values graphically by pressing the button (Figure 5, C) and adjusting the cut off parameters as described in the AgileVariantViewer user guide. The Read depth options panel also contains the , and options (Figure 5, D). These select homozygous, heterozygous, or homozygous+heterozygous variants for display, respectively.
The effect of adjusting the sequence variant cut-off parameters
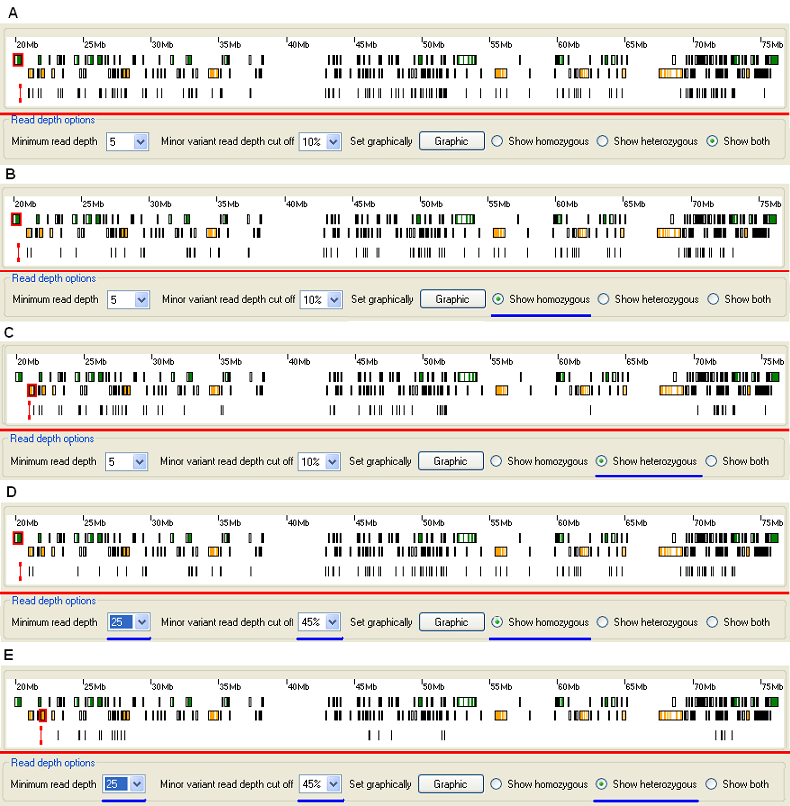
Figure 6: The effect of selecting the , or options, and of changing the read depth and minor allele frequency cut-off values. (Non-default settings are highlighted by a blue line.)
Figure 6 shows the graphical display of a autozygous region on Chromosome 10, in the ATOH7 data set. In 6A, the default cut-off values for read depth and minor allele frequency, and the option are selected. Figures 6B and 6C show the effect of selecting the and the options in turn, again with the default cut-off values for read depth and minor allele frequency. Figures 6D and 6E again illustrate the effect of selecting the and options in turn, this time after increasing the read depth and minor allele frequency cut-off values. By increasing these default values, the number of displayed heterozygous variants is significantly reduced (6C vs. 6E). In contrast, the number of displayed homozygous variants is less affected by this increase in the cut-off values (6B vs. 6D).
Viewing different classes of filtered sequence variantss
If the sequence variants have been filtered by AgileKnownSNPFilter choices are available to view sequence variants that have an RS number, sequence variants that are in the 1000 Genomes Project data set but have no RS number, previously unknown sequence variants, or all sequence variants. Figure 7 demonstrates the effect of selecting each of these classes of sequence variant, across an autozygous region (on Chromosome 10, in the ATOH7 data set).
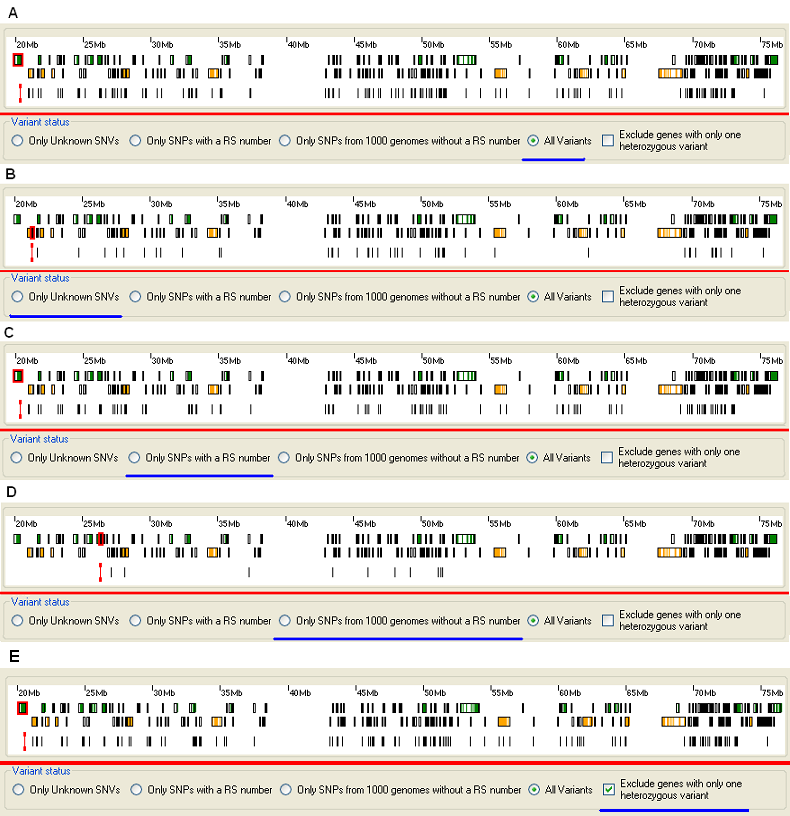
Figure 7: Displaying different classes of sequence variants. (The selected option is highlighted by a blue line.)
The , , and options on the Variant status panel allow each class of filtered sequence variant to be displayed (Figure 7). The third of these options (displaying variants that have been seen in the 1000 Genomes Project, but do not have an RS number) yields very few displayed variants, compared to the number of those with an RS number. This result is interesting, given that 55% (296,456 / 538,332) of the sequence variants used by AgileKnownSNPFilter to filter the sequence variants fall into this category. If the patient is believed to be a compound heterozygote, is is possible to ignore all heterozygous variants linked to gene with only one heterozygous variant, this is done by ticking the box (Figure 7 E).
Viewing sequence variants by location relative to genomic features
The location of a sequence variant within a functional feature of a gene (exon, intron, splice site or Kozak consensus site) can be a strong predictor of the variant’s severity. Therefore, the program can display the set of variants identified in each of these locations.
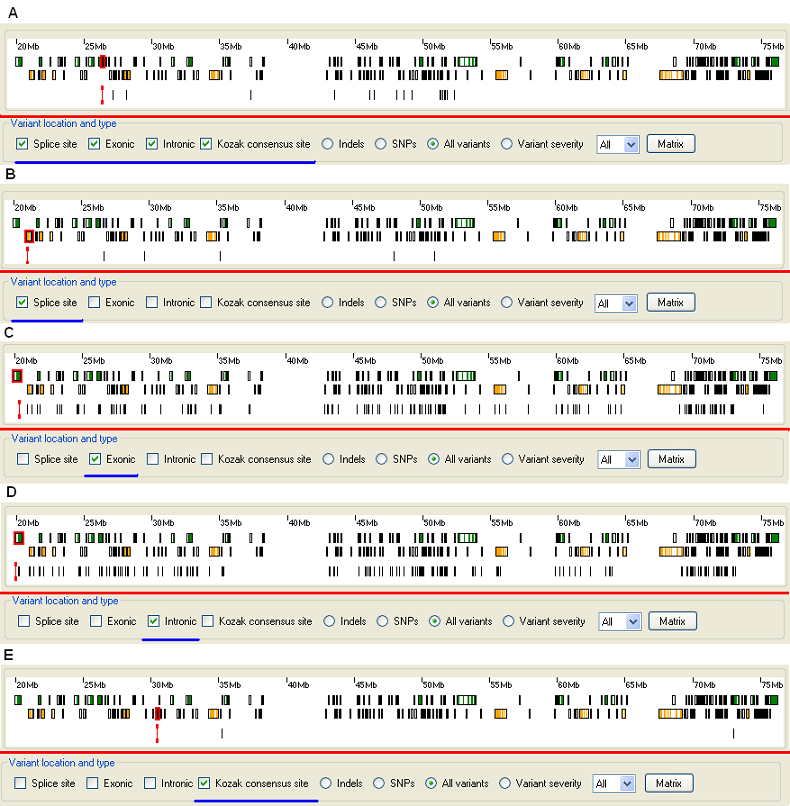
Figure 8: Displaying sequence variants according to location within different parts of a gene. (The selected option is highlighted by a blue line.)
The , , and options on the Variant location and type panel allow sequence variants to be displayed depending on their location within one of these elements (Figure 8). By default, variants in the exons, splice sites and Kozak consensus sequence are displayed. However, it is possible to display sequence variants located within any combination of gene features. For example, Figure 8A shows variants from any of the features, whereas in 8B to 8E those from each of the categories in turn are shown.
Displaying sequence variants based on their possible severity
Since sequence variants that alter or disrupt a protein sequence are the most likely to be pathogenic, the displayed variants can be filtered according to simple categories that may influence severity of impact (Figure 9).
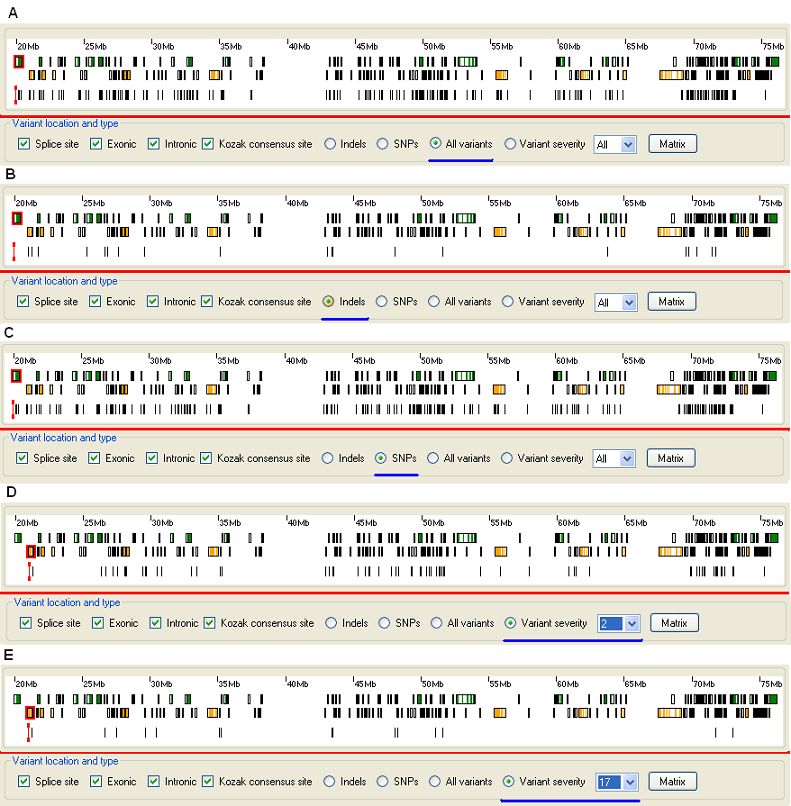
Figure 9: Displaying sequence variants based on their possible severity.
While it is possible to display all the sequence variants identified in a region (Figure 9A) it is also possible to select variants based on their possible severity using the , , and options on the Variant location and type panel. By default, the option is selected (Figure 9A). If the option is selected only insertions or deletions are shown (Figure 9B). Selection of displays the single base change variants (Figure 9C); since these vastly outnumber the other classes of variant, this creates a display very similar to the default option.
When using the option, the severity of each sequence variant is calculated using a matrix derived from the scoring system used by the BLASTP alignment algorithm to align protein sequences. The matrix scores how likely it is, during evolution, that one amino acid will be substituted, and how often a particular substitution occurs. A conservative change like alanine to glycine scores 1, whereas a tryptophan to cysteine change scores 25. This scoring system is simplistic and does not take into account any structural information. For example, glutamate to aspartate scores 4, suggesting a modest effect, but if an individual glutamate is used to bind a zinc atom, this substitution might nonetheless disrupt an enzymatic activity. Despite these restrictions, since the BLASTP scoring system is easily performed, it can be useful for quick screening of variants during a preliminary analysis. The cut-off value for this function is set using the options list to the right of the option. Pressing the button allows the scoring matrix to be saved to disk as a web page (view here). The default value is All, which shows all variants, where as a value of 0 shows only variants that affect a genes protein's amino acid sequence.
Viewing the annotation of a single sequence variant
The Sequence variant data panel, below the Data view panel, shows the annotation linked to each of the sequence variants (Figure 10). By default only a few lines of data is displayed, however by ticking the box in the top, right corner of the Variants panel, the text box is expanded to occupy the majority of the Data view window (Figure 10). There are three panels to the right of the text area, which contain options for the selection of a sequence variant (Variants panel), the selection of a genomic region to view (Region view panel) and saving the annotation of the currently selected variant (Save panel). The options in the Region view panel, duplicate the options in the Region view options panel that were described earlier (see the 'Selecting a genomic region to view' section, Figure 4). The Save panel enables the current sequence variant's annotation, as shown in the text area, to be saved to a file. If the annotation text is manually altered, this will be saved to the file, however any changes to the annotation will be lost when a new sequence variant is selected.
The Variants panel lists all the sequence variants currently visible in the list below the Select variant label. Selecting an item from this list displays the annotation for the relevant variant. The variants are listed in the chromosomal order of the genes they are linked too, and then by their position in the gene. If two genes overlap, all the variants in the gene that contains exon closest to the p arm telomere are listed first and then the variants in the second gene. If a sequence variant is selected from this list in this panel, the annotation for that variant is displayed in the text area and the position of the variant is highlighted by a red line in the upper display panel, while the linked gene is highlighted by a red rectangle (Figure 3).
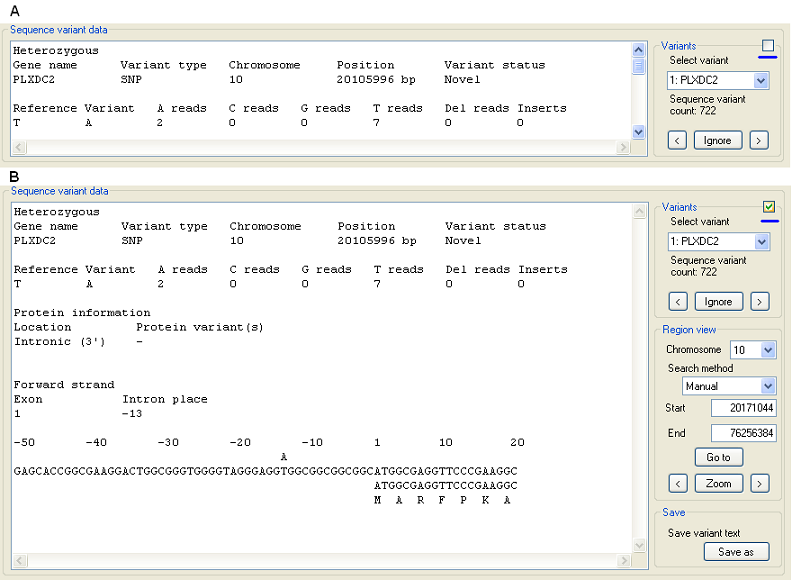
Figure 10: Viewing the sequence variant annotation text. The text area is expanded by ticking the box to the top, right corner of the Variants panel (highlighted by the blue lines).
It is also possible to move sequentially through the list of sequence variants using the and buttons found at the bottom of the Variants panel. Pressing the button, located between the and buttons, stops the currently selected variant from been exported to file when the button on the Export data options panel is pressed. Sequence variants that have been 'Ignored' can be identified as their position is marked by a pink line in the Sequence variant display panel, the word 'Ignored' appears on the first line of the variants annotation text and the text on the button becomes (Figure 11, the blue lines highlight these changes). To undo this selection, navigate to the sequence variant and press the button which is now labeled .
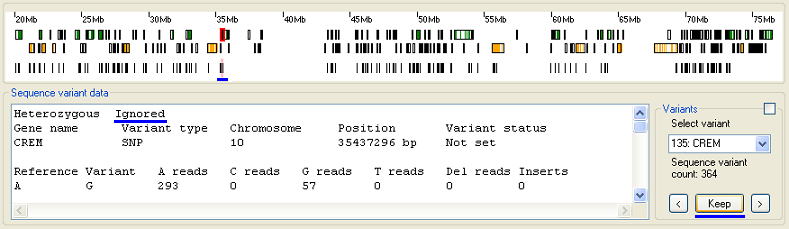
Figure 11: Pressing the stops the currently selected variant from been exported.
The first line of the annotation text states where the sequence variant is either homozygous or heterozygous. Next the text displays some basic information about each sequence variant, this
includes the name of the gene linked to the variant, the type of variant it is, is genomic position and the variants status.
A sequence variant can be one of three types:
- Single nucleotide variants (SNV)
- Deletion
- Insertion
Whereas a variants status can be:
- Has an RS number, in which case the RS number is displayed.
- Seen in the 1000 genome dataset but doesn't have an RS number, in which case '1000 genome' is displayed.
- Not seen in the 1000 genome dataset, in which case 'Novel' is displayed.
- Variants file not filtered, in which case 'Not set' is displayed.
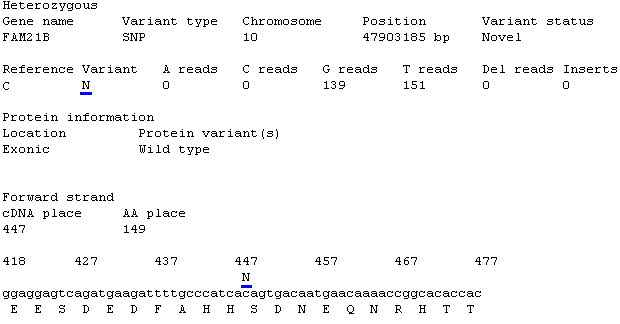
Figure 12: If the two must common alleles do not map to the reference nucleotide the
position is called as a 'N' nucleotide.
Next the text displays a table stating the reference sequence's nucleotide at the variant position, followed by the variant nucleotide. The number of reads mapped to the variants position for each of the nucleotides along with the number of reads that contained a deletion or insertion are then displayed. If the two must common alleles do not map to the reference nucleotide the position is called as a 'N' nucleotide (Figure 12).
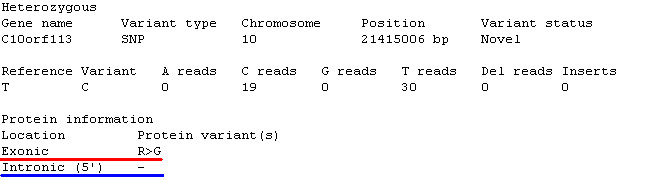
Figure 13: If a gene is alternatively spliced and the sequence variant affects
the transcripts in different ways, each possible affected is noted.
The protein information section contains information on the location of the sequence variant and the possible effect it has on the genes product. If a gene is alternatively spliced and the sequence variant affects the transcripts in different ways, each possible variation is noted. In Figure 13 the sequence variant is located in the exon of one set of transcripts (highlighted by the red line) and in the 5' sequence of an intron in a second set of transcripts (highlighted by the blue line). The possible locations for a sequence variant and effects on the protein are listed below:
| Location | Possible affect | Text in table |
|---|---|---|
| Intronic (3') | None | - |
| Kozak site | Aberrant translation | Incorrect protein initiation? |
| Splice site (5') | Aberrant splicing | Incorrect splicing? |
| Exonic | Doesn't affected the amino acid sequence | Wild type |
| Exonic | Changes amino acid | Shows protein variant e.g. D>H |
| Exonic | Indel variant/frameshift | Shows protein variant e.g. V>FS |
| Splice site (3') | Aberrant splicing | Incorrect splicing? |
| Intronic (5') | None | - |
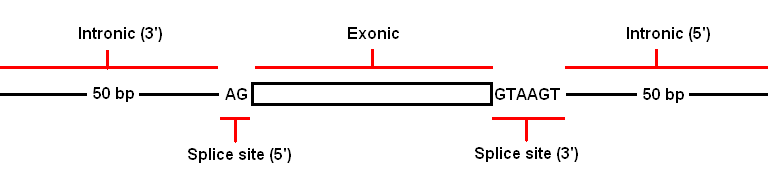
Figure 15: The location of a variant can be intronic (3'), splice site (5'), exonic, splice site (3'), or intronic (3').
The 5 prime and 3 prime designation in the terms "Splice site (5')" and "Splice site (3')" refers to the 5 prime and 3 prime ends of the exon (Figure 14).
Below the protein information section, the orientation of the transcript (forward or reverse strand) is noted followed by the variants location. If the variant is exonic, the variants location in the cDNA and the position of the amino acid that may be affected is shown. Otherwise the location of the nearest exon to the change and its intronic position relative to the exon is shown (Figure 15).
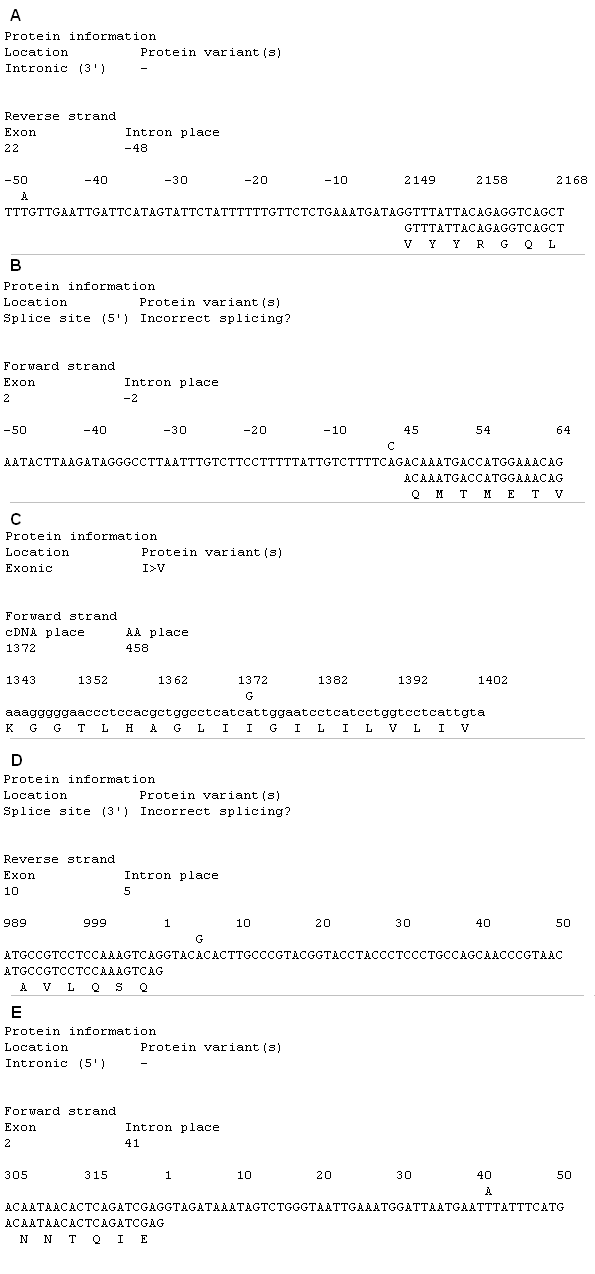
Figure 15: The sequence flanking a variant is displayed as an alignment for
intronic (3') (A), splice site (5') (B), exonic (C), splice site (3') (d), or
intronic (3') (E)
variants.
The variants are also shown along side an alignment of the flanking sequences, for exonic variants the alignment shows the transcripts open reading frame and amino acid sequence. Intronic variants are shown as an alignment containing 50 bp of intronic sequence and 20 bps of the nearest exon with any amino acid sequence. The numbers above the intronic sequence, identify the nucleotides position relative to the splice site, while the numbers above the exon coding sequences identify the nucleotides position relative to the start codon in the open reading frame. All the alignments are shown in the direction of transcription (mRNA's 5' to 3') irrespective of the genes chromosomal orientation. If a gene produces multiple transcripts, an alignment for each of the transcripts is shown where the annotation differs from a previously described transcript (Figure 16).
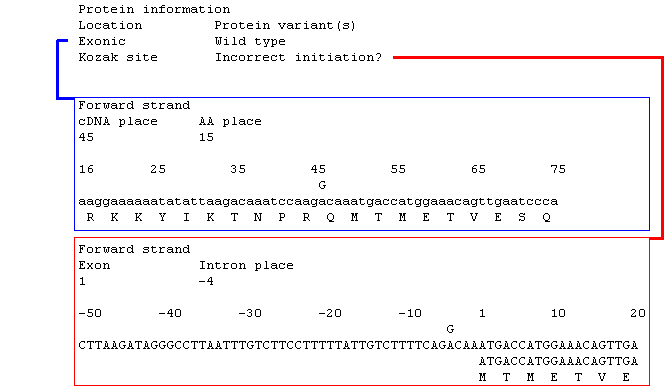
Figure 16: The alignments for a gene with multiple transcripts are produced where the annotation for a transcript differs from one previously described.
Annotation of deletion and insertion sequence variants
The annotation for deletion and insertion sequence variants differs slightly from the annotation of single base variants, in Figure 17 the differences are highlighted by blue rectangles for deletions and red rectangles for insertions. For deletions the variant base description shows the reference base prefixed with 'Del' to show that it is deleted and in the sequence alignment the position of the deleted base is shown as a '-' above the reference sequence. If the deletion is in the open reading frame the protein variant is described as S>FS, where S is the first amino acid affected by the deletion and FS indentifies the protein variant as a frame shift. The annotation of an insertion variant does not refer to an affected reference base, instead it states the inserted base(s). Since it is not uncommon for an insert to have several different insertion sequences mapped to a single position, all the different sequences are displayed along with the number of reads that contained each insert. In the protein information section, exonic insertion variants are labeled with the phrase 'Frame shift' followed by the insertion sequence and the number of reads containing it. Finally, the insert is placed other the reference sequence in the alignment at point the inserted base would occur. For example, the major insert shown in Figure 17B is a single 'C' base that is inserted in the middle of the sequence 'cccatg' to create the sequence 'cccGatg'.
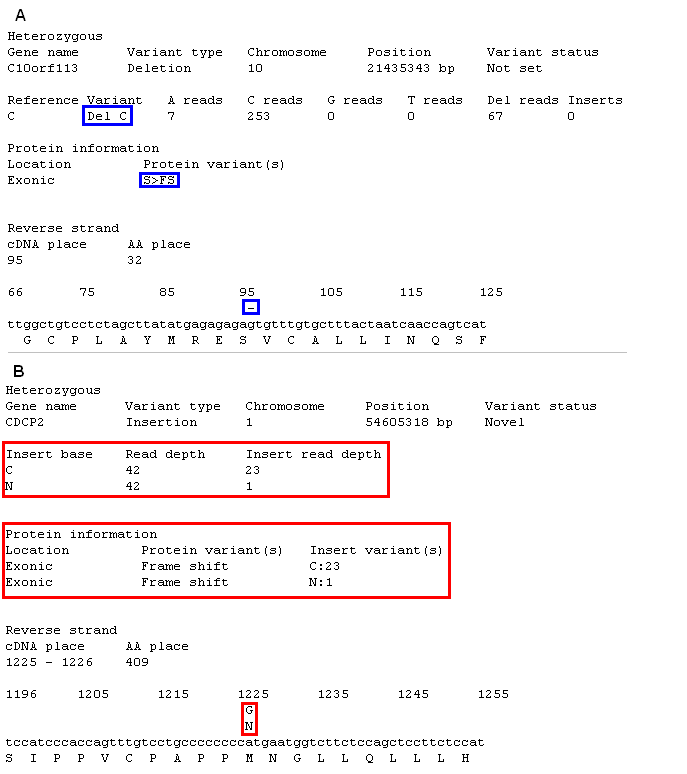
Figure 17: Annotation of deletion and insertion sequence variants.
Exporting filtered sequence variant data
It is possible to export the sequence variants, using the same criteria as that used to display them in the graphical display, by using the setting in the Export data options (Figure 13). For instance to export sequence variants that have not been found by the 1000 Genome project and do not occur in intronic sequence, select the option in the Variant status panel (Figure 10) and select the , , and options on the Variant location and type panel.

Figure 18: Exporting filtered sequence variant data.
Once the various parameters have been set, it is possible to export the sequence variants that meet these cut off values by pressing the button in the Export data options panel (Figure 18). If there is no positional information available, it is possible to export sequence variants from the whole genome by selecting the option in the Export data options panel (Figure 18). Otherwise it is possible to export sequence variants from either the currently selected chromosome or chromosomal region, by selecting the appropriate or option in the Export data options panel (Figure 18). If the disease causing variant is believed to be homozygous, it is possible to export only homozygous variants by ticking the boxes. Similarly, if the patient is believed to be a compound heterozygote, ticking the will export heterozygous variants only if two or more heterozygous variants are present in the gene. Selecting both of the options will export both sets of variants. If the condition is believed to be dominantly inherited then do not select either of these options. While it is possible to select if only homozygous or heterozygous variants are displayed in the Sequence variant display panel using the , or the options in the read depth options panel, these options are ignored when exporting variant data.
If the box is ticked, a second file will also be created when the button is pressed. This file contains a list of the substitution variants (but no indels) formated so that they can be directly imported in to the PolyPhen batch query web page and allow the severity of each variant to be calculated.