Reference peak selection
QSVanalyser allows the user to select any combination of peaks in the range of positions -10 to -5 (upstream of the sequence variant under study) for use as reference peaks to which the test peak heights are normalized. (See Section 1.4 of the QSVanalyser guide.)
This page gives examples of the effects of varying the choice of reference peak(s), across all 63 possible permutations of 1, 2, 3, 4 or 5 reference peaks.
We use as an example a 7p22 amplicon present at four copies per diploid genome. This amplicon contains four sequence variants that display combined allelic and paralogous sequence variation, giving possible variant proportions of 0:4, 1:3, 2:2, 3:1 or 4:0. (See the QSVanalyser paper for further detail.) The structure of this amplicon and positions of the four sequence variants, are as follows:
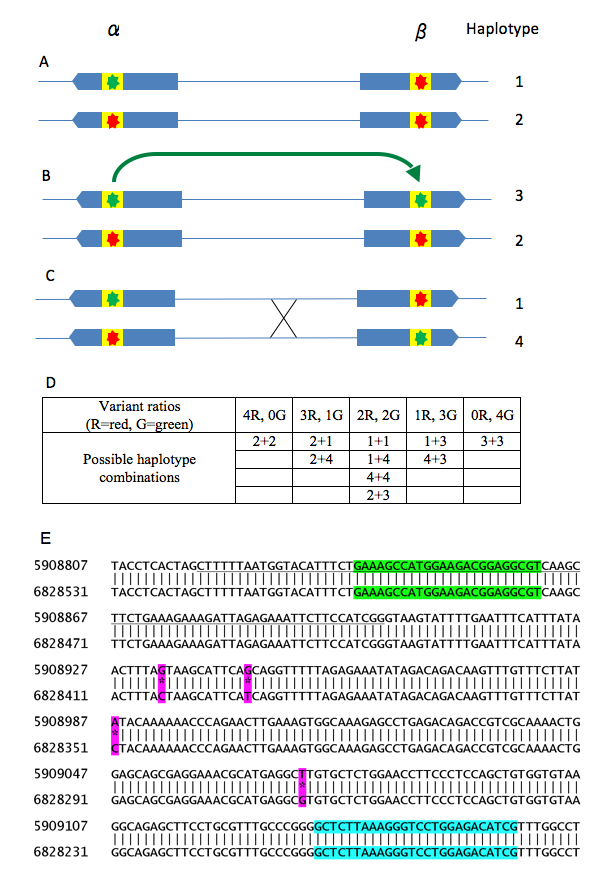
Figure 1: Description of the 7p22 amplicon displaying mixed allelic and paralogous polymorphism. The locus contains two homologous inverted 100-kb sequences, α and β (blue arrows), ~0.7 Mb apart. (A) If a single-nucleotide mutation occurs in region α (green star) it initially creates a new region α SNP. However, due to gene conversion (B, green arrow) the new sequence variant can be transferred to the β region. (C) Homologous recombination between the alleles can then place the new β-region variant in cis with the original variant in the α region. The variant has now become a polymorphism within both duplicated regions. Since the sequences of the two regions are highly similar, PCR amplification of the variant will result in co-amplification of sequences from both α and β regions (yellow box). Therefore (D), amplicons can be generated within which the sequences of the old and new variants are present in the ratios of 4:0, 3:1, 2:2, 1:3 or 0:4. (E) Actual amplicon containing four sequence variants (PSVs A, B, C, D; referred to as 11–14 in Figure 4 of the QSVanalyser paper) of the type illustrated above. The alignment is between two reference sequence regions at 5.9 Mb and 6.8 Mb. The underlined segment is exon 6 of the predicted C7orf28A/C7orf28B gene. The PCR primer sites are highlighted in green and blue. The sequence variants highlighted in magenta are listed in the order in which they appear in Figure 4 and Supplementary Figure 1B of the QSVanalyser paper (lanes 11–14).
Test system
A set of 96 DNA samples were analysed by PCR-amplification of the above amplicon, and sequencing in the forward direction. The resulting electropherograms were analysed by QSVanalyser sequentially, using each of the 63 possible reference peak combinations, at each of the four variant sequence positions.
| 1 reference peak |
−10 | −9 | −8 | −7 | −6 | −5 | ||||||||||||||
|---|---|---|---|---|---|---|---|---|---|---|---|---|---|---|---|---|---|---|---|---|
| 2 reference peaks |
−10 −9 |
−10 −8 |
−10 −7 |
−10 −6 |
−10 −5 |
−9 −8 |
−9 −7 |
−9 −6 |
−9 −5 |
−8 −7 |
−8 −6 |
−8 −5 |
−7 −6 |
−7 −5 |
−6 −5 |
|||||
| 3 reference peaks |
−10 −9 −8 |
−10 −9 −7 |
−10 −9 −6 |
−10 −9 −5 |
−10 −8 −7 |
−10 −8 −6 |
−10 −8 −5 |
−10 −7 −6 |
−10 −7 −5 |
−10 −6 −5 |
−9 −8 −7 |
−9 −8 −6 |
−9 −8 −5 |
−9 −7 −6 |
−9 −7 −5 |
−9 −6 −5 |
−8 −7 −6 |
−8 −7 −5 |
−8 −6 −5 |
−7 −6 −5 |
| 4 reference peaks |
−8 −7 −6 −5 |
−9 −7 −6 −5 |
−9 −8 −6 −5 |
−9 −8 −7 −5 |
−9 −8 −7 −6 |
−10 −7 −6 −5 |
−10 −8 −6 −5 |
−10 −8 −7 −5 |
−10 −8 −7 −6 |
−10 −9 −6 −5 |
−10 −9 −7 −5 |
−10 −9 −7 −6 |
−10 −9 −8 −5 |
−10 −9 −8 −6 |
−10 −9 −8 −7 |
|||||
| 5 reference peaks |
−10 −9 −8 −7 −6 |
−10 −9 −8 −7 −5 |
−10 −9 −8 −6 −5 |
−10 −9 −7 −6 −5 |
−10 −8 −7 −6 −5 |
−9 −8 −7 −6 −5 |
||||||||||||||
| 6 reference peaks |
−10 −9 −8 −7 −6 −5 |
|||||||||||||||||||
For each of the 96 samples, the resulting CNP values are plotted as a graph, against the reference sequence type on the X axis (Figure 2).
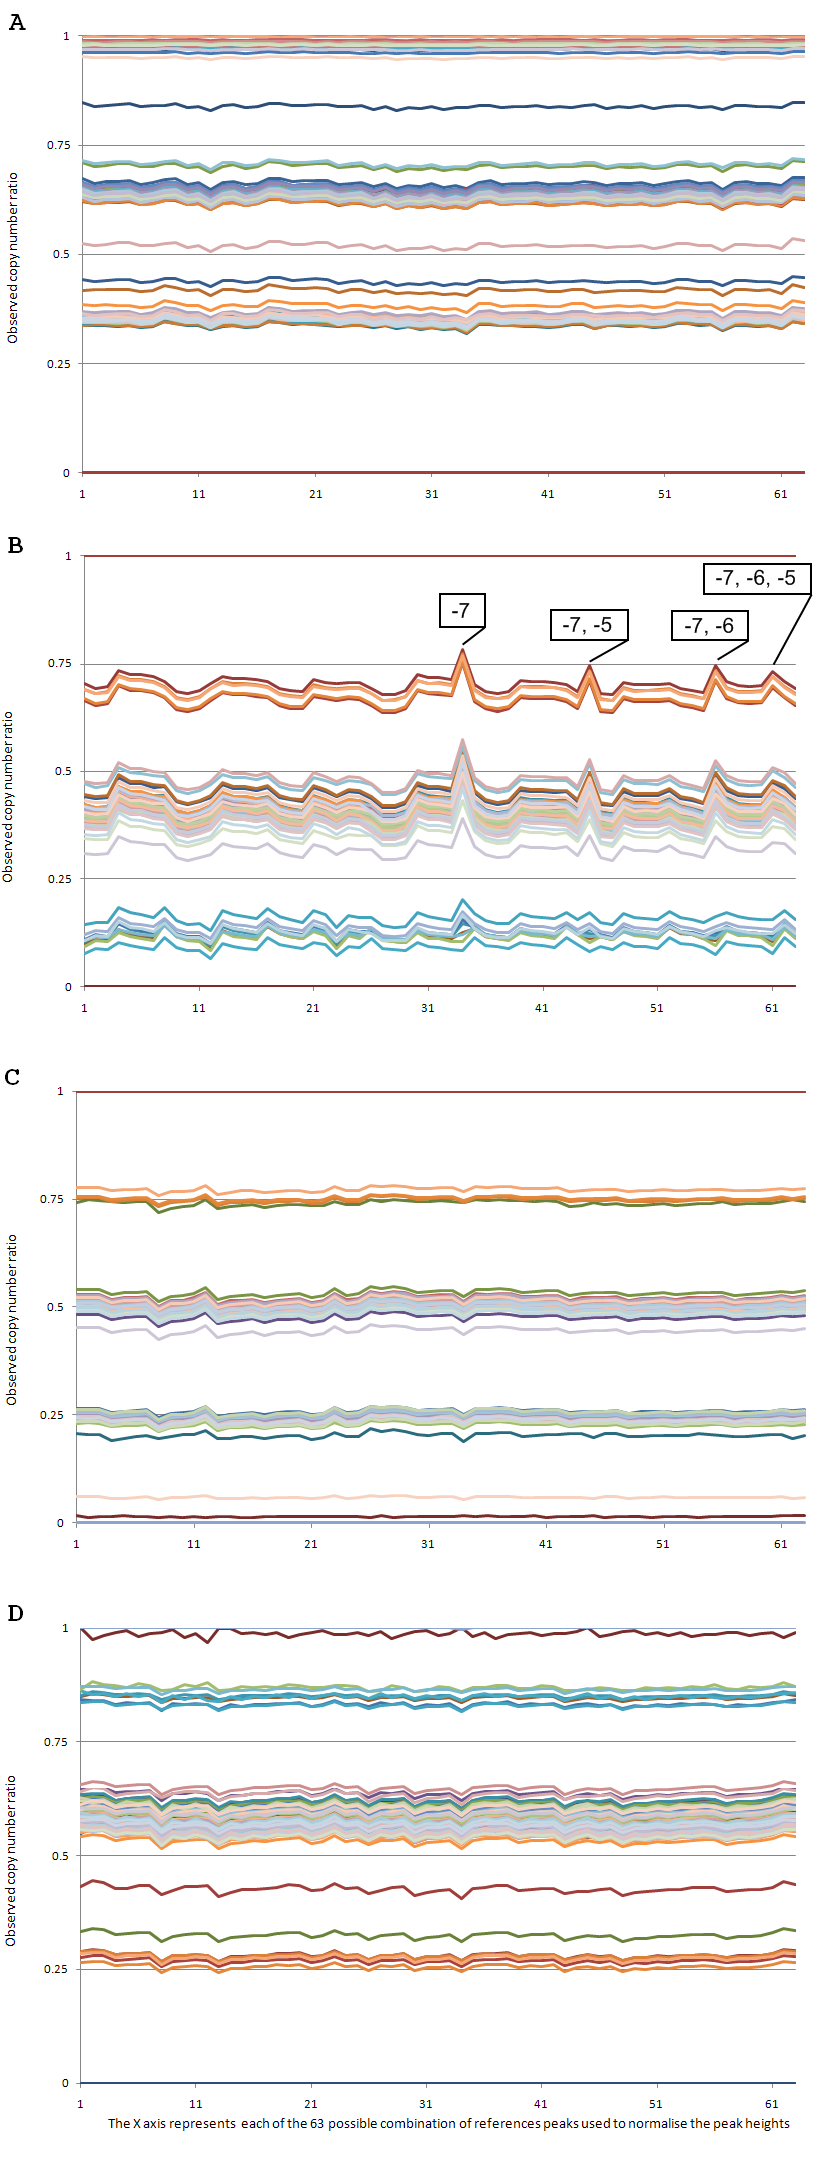
Figure 2
Interpretation
For three of the four variants, the choice of reference peak (or combination of reference peaks) has little effect. In particular, the variation in CNP value is seen to be mostly sample-dependent, the ranking of individual samples remaining the same (with few exceptions), whichever reference peak(s) are chosen.
For variant B, however, the results are more variable; certain choices of reference sequence yield CNP values that diverge from the more typical results obtained with the rest of the 63 reference peak choices.
As annotated on Figure 2B, the "outlier" reference peak combinations all include the -7 peak. As described in the main QSVanalyser guide, Section 2.2, statistics on peak height variability can be displayed using the option to create an HTML page. For the current data set, the output of this option is as follows:
| Base position | Mean adjusted peak height | Standard deviation of the adjusted peak height | STD to Mean ratio |
|---|---|---|---|
| -10 | 1000 | 0 | 0 |
| -9 | 1166.192 | 66.83519 | 0.057 |
| -8 | 1086.66 | 58.61914 | 0.054 |
| -7 | 1150.628 | 123.2231 | 0.107 |
| -6 | 1261.947 | 73.09021 | 0.058 |
| -5 | 1154.234 | 65.50758 | 0.057 |
It can be seen that the "problematic" reference peak at -7 shows a much larger standard deviation (highlighted) than any of its neighbours. It could therefore have been identified and excluded as a suitable reference peak in advance of the analysis, (as described in the guide).
It may also be noted from Figure 1E that variant B is the only one of the four variants to have another sequence variant lying close upstream of it. It is likely therefore that the large standard deviation in peak height at the B(-7) position results from the effect of variable genotype at the nearby A variant. This underscores our recommendation to avoid, where possible, the analysis of sequence variants that lie closely downstream of other sequence variants.