AgileVCFMapper
Comparison of between using exome and microarray derived variant data.
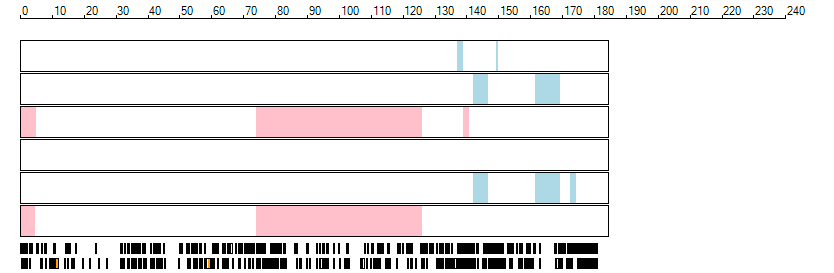
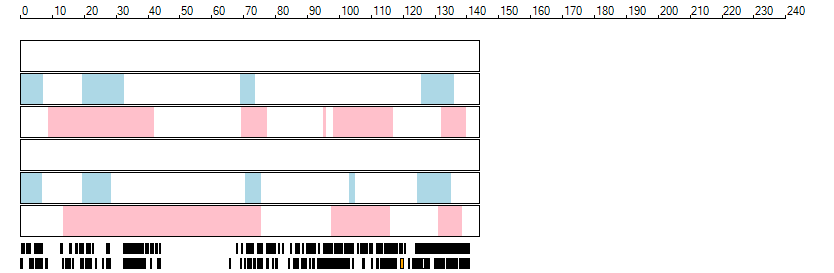
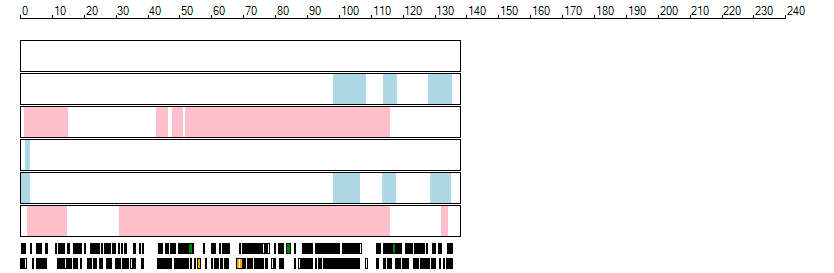
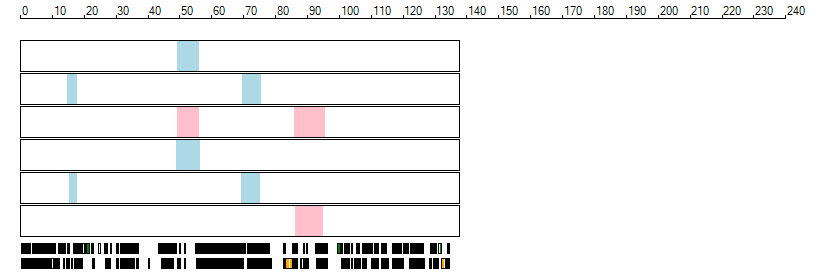
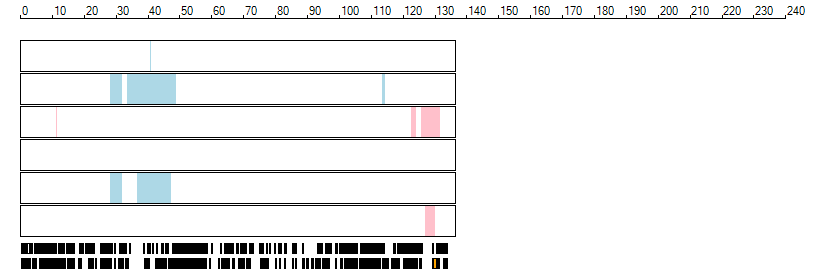
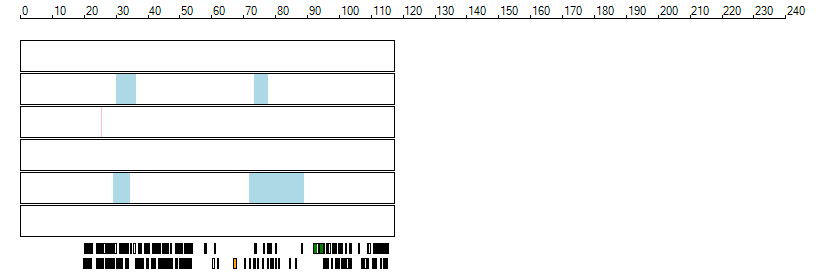
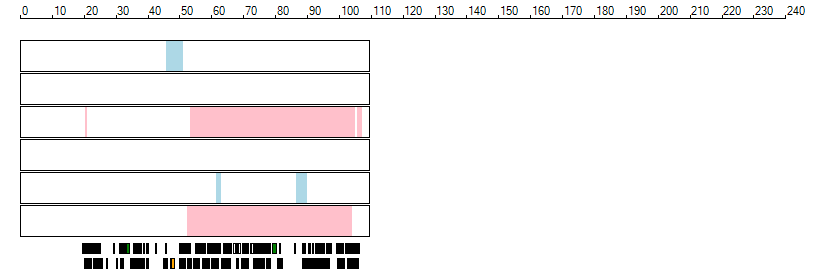
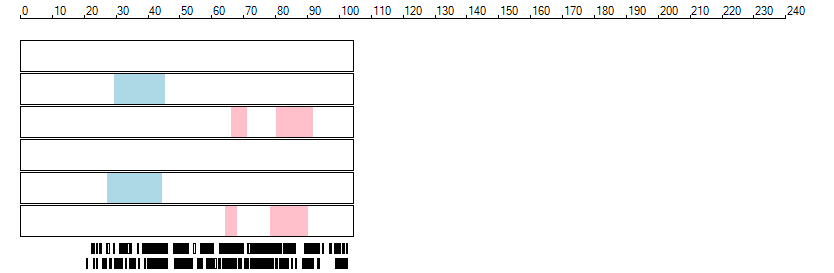
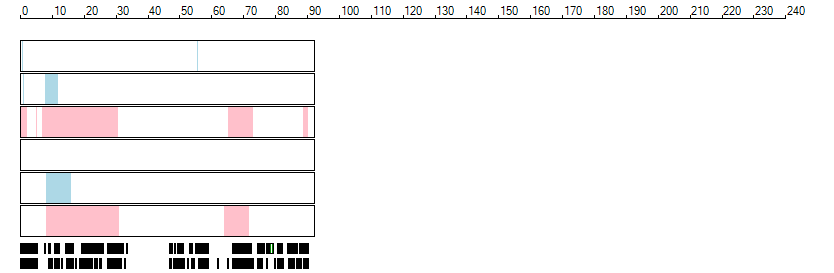
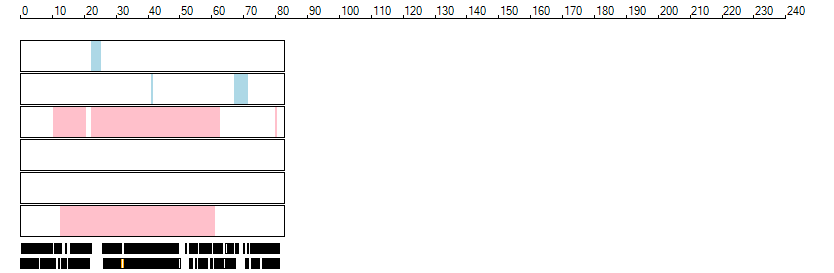
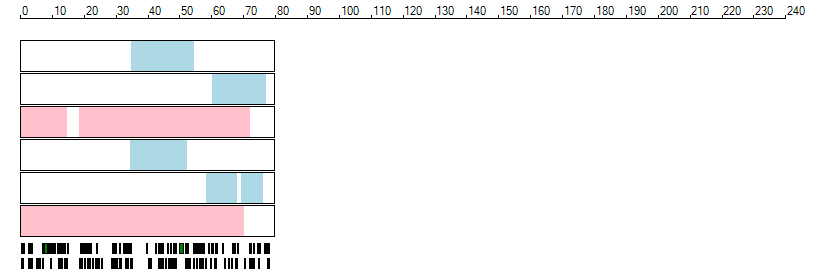
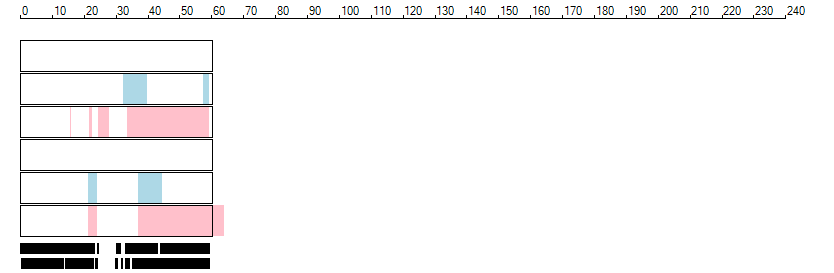
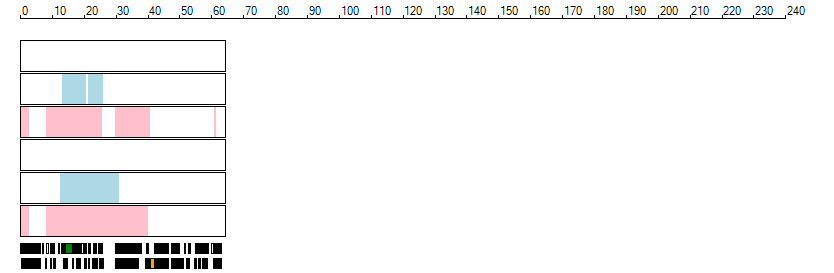
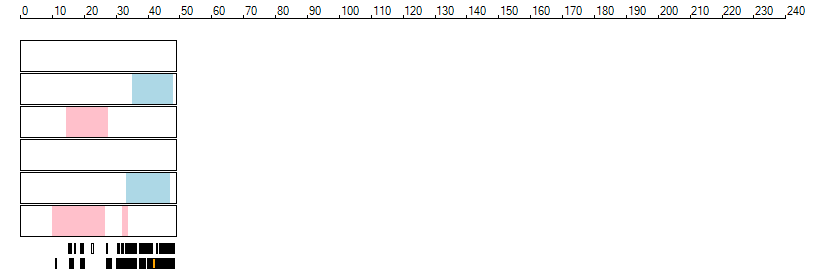
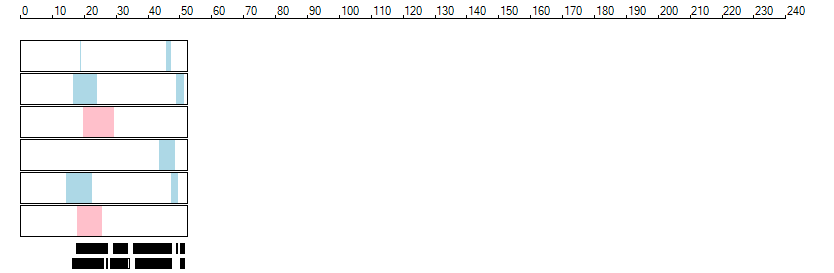
The images below show the autozygous regions identified using data derived from Exome variant data (top three rows in each image) or Affymetrix SNP 6.0 microarray genotype data (lower three rows in each image) as analysed by AgileVCFMapper. While the overall pattern is roughly comparable, there are notable differences between the data sets. This is the result of the lower number of variants, uneven coverage and increase miscalled rate of the data derived from the exome data when compared to the better microarray data. It is likely that the situation will be improved if whole genome sequence data is used instead of exome data. At the bottom of each image are a series of black rectangles which show the position of genes on each chromosome. The presence of a centrome as seen by large gaps in the gene coverage is often the cause of differences in the detection of autozygous regions from exome and microarray data.
| Chromosome 1 |
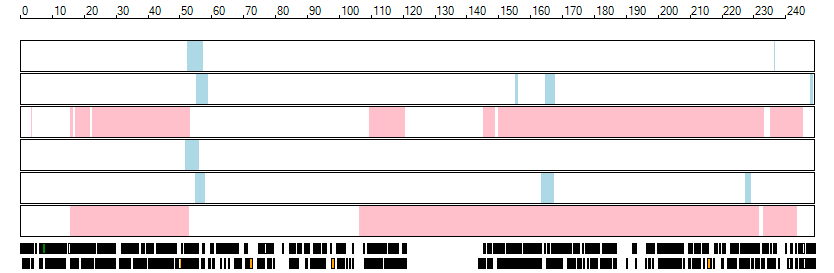 |
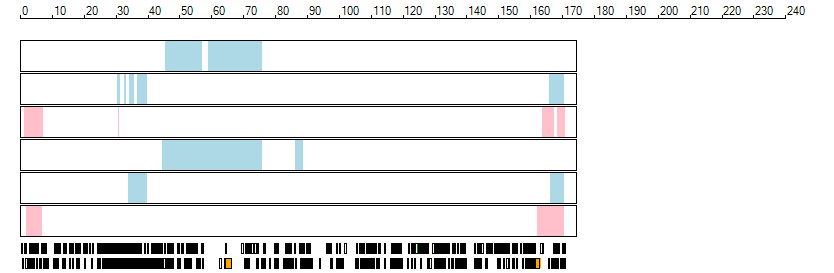
| Chromosome 2 |
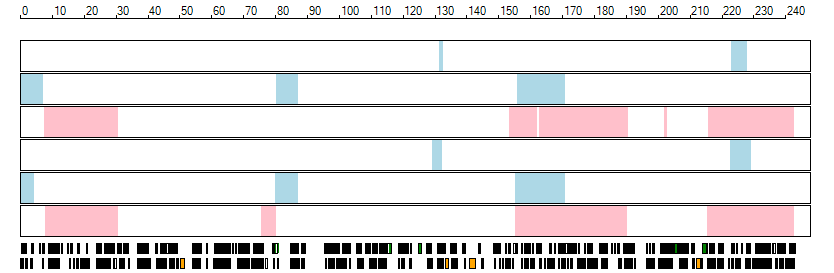 |
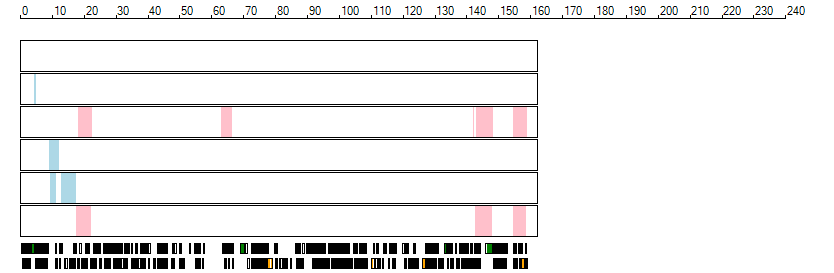
| Chromosome 3 |
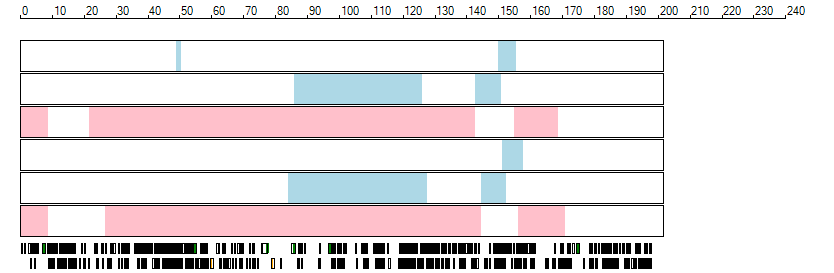 |
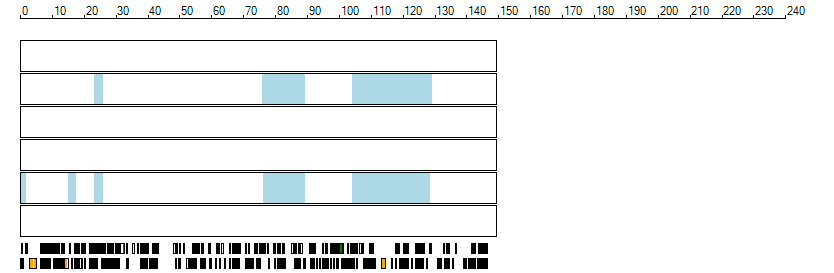
| Chromosome 4 |
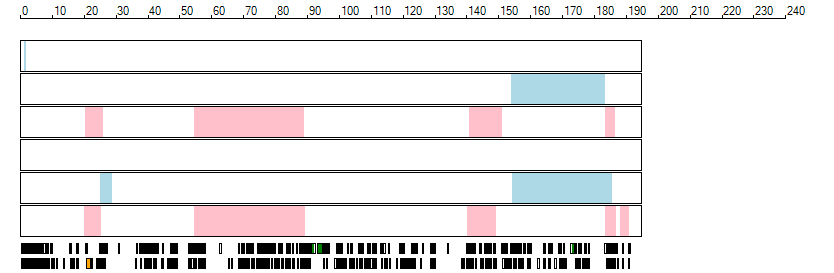 |
| Chromosome 5 |
 |
| Chromosome 6 |
 |
| Chromosome 7 |
 |
| Chromosome 8 |
 |
| Chromosome 9 |
 |
| Chromosome 10 |
 |
| Chromosome 11 |
 |
| Chromosome 12 |
 |
| Chromosome 13 |
 |
| Chromosome 14 |
 |
| Chromosome 15 |
 |
| Chromosome 16 |
 |
| Chromosome 17 |
 |
| Chromosome 18 |
 |
| Chromosome 19 |
 |
| Chromosome 20 |
 |
| Chromosome 21 |
 |
| Chromosome 22 |
 |
Last modified: Mon, 10th Feb 2014, at 5:04 pm