User guide
Introduction
AgileMultiIdeogram displays the locations of autozygous regions in multiple individuals one chhromosome at a time or against a linear or circular ideogram of chromosomes 1–22. The autozygous regions can be supplied as predefined regions in a text file or they can be automatically identified either from exome variant lists or microarray SNP genotype data.
Entering data
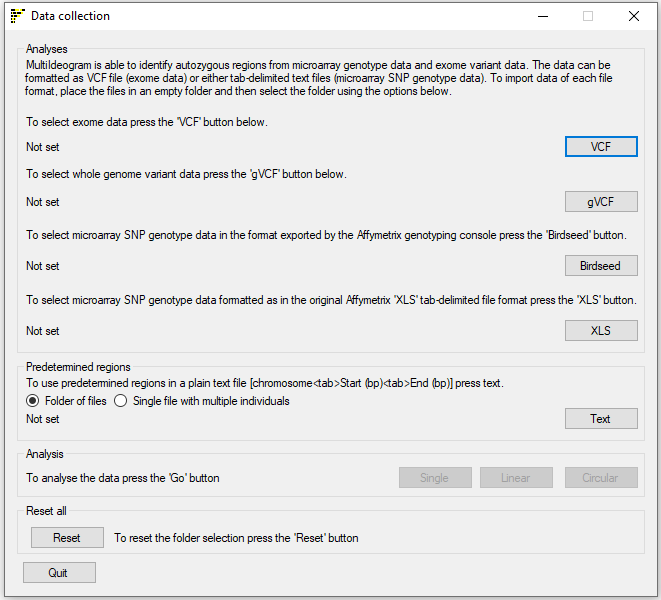
Figure 1: User interface of AgileMultiIdeogram
AgileMultiIdeogram works with predefined regions in a text file(s), variant data derived from microarray SNP genotyping or high throughput sequencing (*.vcf, *.vcf.gz, *.g.vcf or *.g.vcf.gz) or any combination of them.
NGS variant data
To use NGS derived variant data, save the variants in the VCF format as *.vcf or with optional compression using gzip as *.vcf.gz files and place all these VCF files in an empty folder and select it by pressing the button. Likewise, when using variant data formatted as genome VCF files as *.g.vcf or with compression as *.g.vcf.gz files and place the files in a single folder and select the folder using the button.
Microarray SNP genotype data
Microarray SNP genotype data can be formatted either as ‘birdseed’ files with the .txt file extension (these files are exported by the Affymetrix Genotype Console) or in the old Affymetrix ‘*.xls’ tab-delimited genotype format. Data from other platforms (such as Illumina microarrays) can be used after reformatting using a data conversion utility. As before, microarray data files should be placed in an empty folder.‘Birdseed’ data files or those in the old tab-delimited format can then be selected using the or button, respectively.
Predefined regions
To use predefined regions in a series of text files enter one regions per line as: chromosome number<tab>start point in bp<tab>end point in bp. Place the files in an empty folder and select the folder using the button with the option selected. AgileMultiIdeogram can export all regions identified in a patient cohort to a single text file, to import this data select the file using the button with the option selected.
Once the relevant data folders have been selected, the , buttons will become active and by pressing one the regions will be visualised as a single chromosome, a linear ideogram or circular ideogram respectively after the affected individuals have been selected using the Affecteds window as shown below in Figure 2.
Identifying data from affected patients
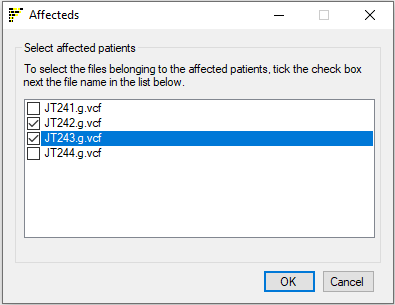
Figure 2: Data files from affected subjects are selected using the
Affecteds window
Data files from affected individuals must now be identified, by ticking the check boxes next to their filenames. Once the disease status appropriate to each file has been specified, the analysis is started by clicking . This will close the current window and open a new Ideogram viewer window as shown in Figures 3, 7 and 8.
Analysing and visualising the data
Since processing the data may take several minutes, the data is displayed as each files is processed. Consequently, the images initially contain just the cytogenetic banding paterns for each chromosome (e.g. figure 3), before each individual's data is added in turn. While its possible to view data in different ways, the menus on each of the windows consist of a core set of options, with only the Single chromosome view containing noticably more options, consequently, the core set of options will be discribed once in the Lineaer ideogram view section.
Linear ideogram
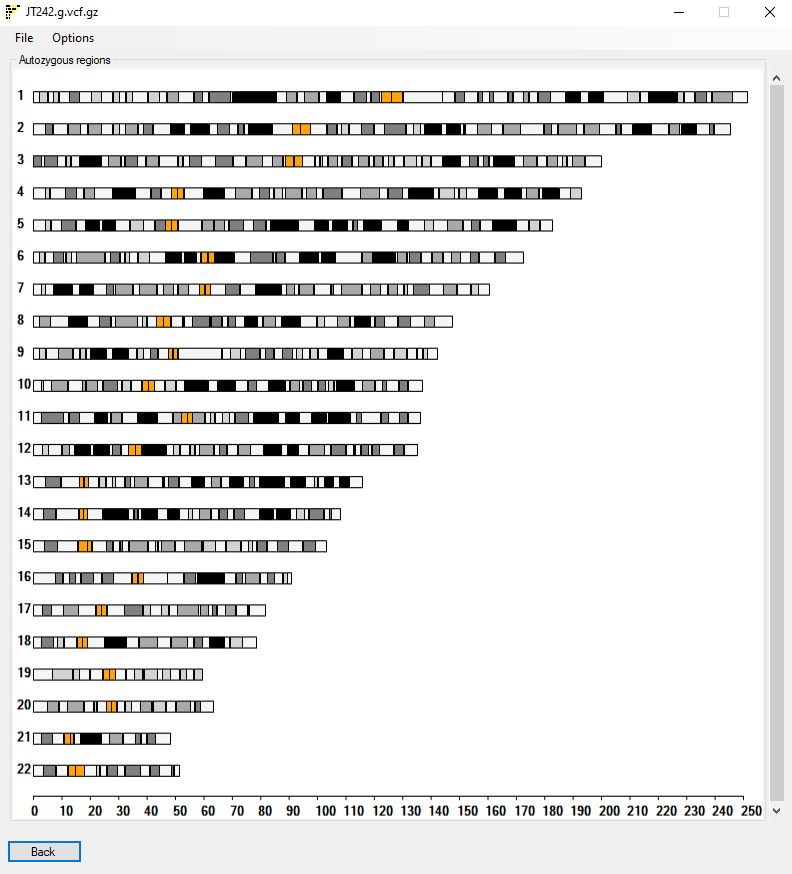
Figure 3: Initial display of the Linear Ideogram viewer window
Initially, the Linear Ideogram viewer window only contains the linear display of the ideograms of the autosomes (Figure 3). As each file is analysed, its name is displayed in the window title bar, while the autozygous regions from previously analysed files are displayed in the the main window (Figure 4).
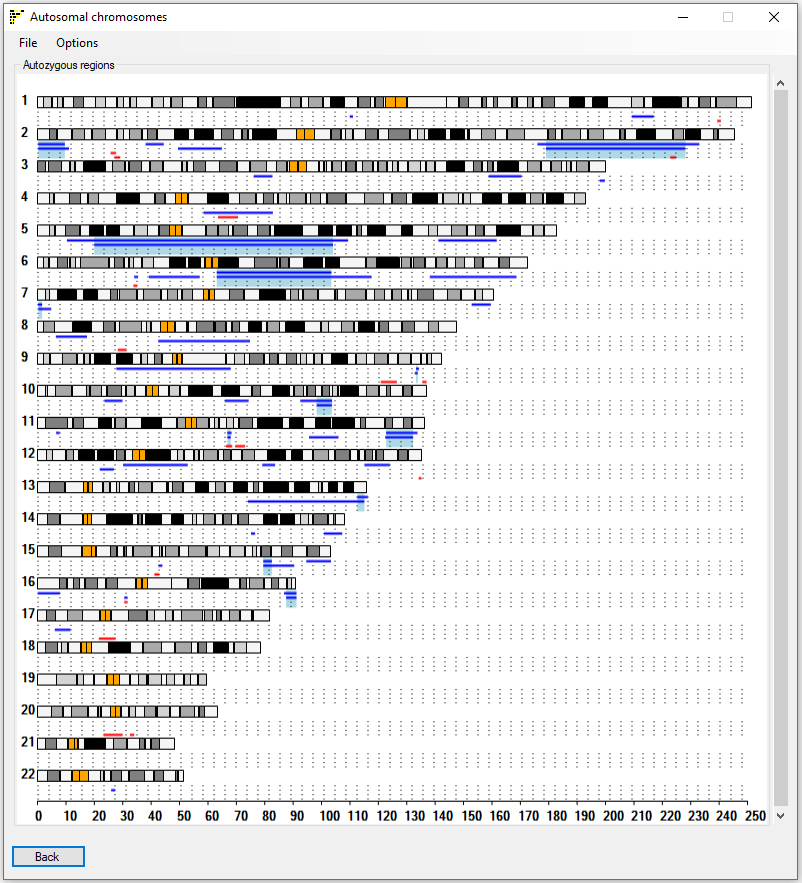
Figure 4: Completed analysis, showing the display of autozygous regions in affected (blue) and unaffected (red) subjects
Once the analysis is complete, the Linear Ideogram viewer window will display the autozygous regions in each input file, as a series of thick lines
(Figure 4). Autozygous regions from affected individuals are coloured blue, while those from unaffected individuals are red. Where a region is homozygous in all affected
individuals, the region is highlighted as a pale blue rectangle. Note that since the data used can come from a wide range of sources it is possible that these overlapping autozygous
regions are not concordant and unaffected individuals may be homozygous for the same haplotypes. (For a discussion of concordant and non-concordant autozygosity,
see here.) If it is desired to take into account the shared or discordant haplotype status of the regions among
different affected individuals, SNP microarray genotyping is preferred, and should be analysed using an appropriate tool such as AutoSNPa.
(Alternatively, NGS data may be analysed using AgileVCFMapper.) None of these programs currently offers the possibility to compare variant
haplotypes across datasets incorporating both microarray and NGS data.
There is no limit to the number of individuals this window will display, if the image becomes taller than the viewing area, the vertical scroll bar to the right of the image becomes
active, allowing the image to be scrolled up and down.
The menu
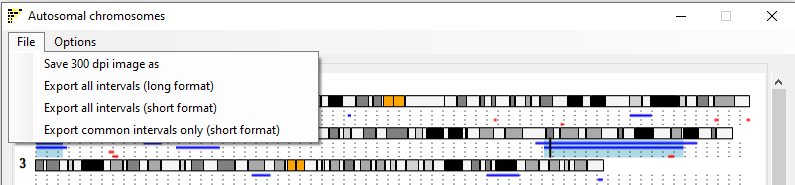
Figure 5: The menu on each of the Viewer windows allows the regions data to be saved as either a text or image files.
The menu on each of the Viewer windows allows the regions data to be saved as either text or image files.
The menu option allows the current image to be saved a publication ready TIFF file.
The menu option saves all the region data to a single file. The data for each original data file follows a line containing the
file's name and then a column header line. Each region is then written as: chromosome number<tab>start point (bp)<tab>End point (bp)<tab>region lenth (bp). At the end of the file the regions common
to all the affected individuals are listed.
The menu option allows the regions to be save as described above except each region line is formated as:
"chr"chromosome number<colon>start point (bp)<hyphen>end point (bp).
This format can be pasted directly in to various third party applications/web pages like The Genome browser or IGV allowing the contents of the region to be viewed.
The menu option saves only the common regions to file, in the short format described above.
The menu
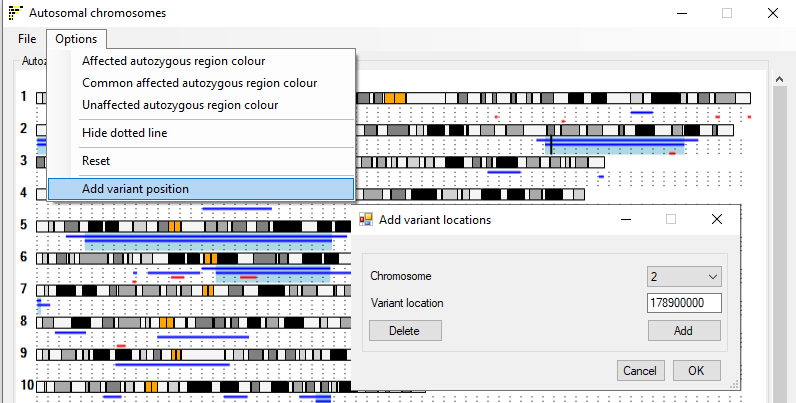
Figure 6: The menu on each of the Viewer windows allows the image to be modified.
The , and
menu options allow the colours used to highlight autozygous regions to be changed.
The menu option is used to either hide or show the dotted lines that help to identify regions that occur in the same individual.
The menu option resets the style of the image to the original default style.
The menu option allows the user to highlight a single position in the genome such as the position of a gene or variant of interest. Selectiing
the option opens the Add variant locations window (figure 6) which allows the position to be entered. If the button is pressed
followed by the button the current position is deleted.
Circular ideogram
As with the Linear Ideogram viewer window, initially, the Circular Ideogram viewer window only contains the circular display of cytogenetic bands of the autosomal chromosomes. As each file is analysed, its name is displayed in the window title bar, while the autozygous regions from previously analysed files are displayed in the the main window (Figure 7).
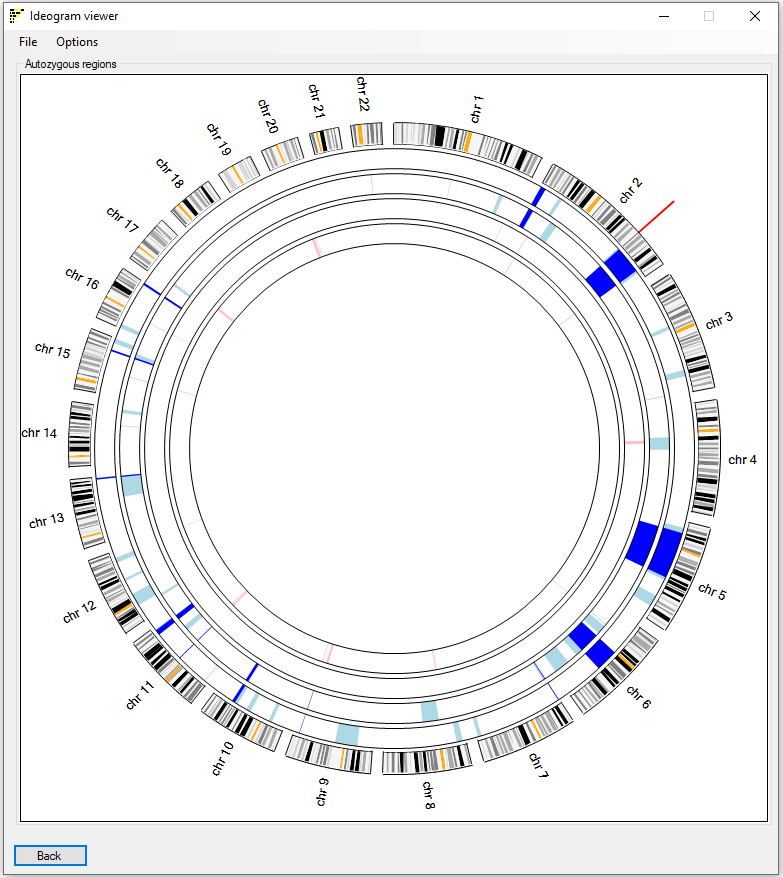
Figure 7: Completed analysis, showing the display of autozygous regions in affected (pale blue) and unaffected (pink) subjects, while common regions to all affected individuals are shown in dark blue. The red mark identifies the location of a position of interest entered via the menu option .
Once the analysis is complete, the Circular Ideogram viewer window will display the autozygous regions in each input file, as a series of block arcs
(Figure 7). Autozygous regions from affected individuals are coloured pale blue, while those from unaffected individuals are pink. Where a region is homozygous in all affected
individuals, the arcs are displayed in a darker blue. Note that since AgileMultiIdeogram does not store haplotype data
for these regions, it is possible that these overlapping autozygous regions are not concordant. (For a discussion of concordant and non-concordant autozygosity,
see here.) If it is desired to take into account the shared or discordant haplotype status of the regions among
different affected individuals, SNP microarray genotyping is preferred, and should be analysed using an appropriate tool such as AutoSNPa.
(Alternatively, NGS data may be analysed using AgileVCFMapper.) None of these programs currently offers the possibility to compare variant
haplotypes across datasets incorporating both microarray and NGS data.
This image only allows the data for a maximum of 11 individuals to be displayed.
: This window contains the same menu structure as the Linear Ideogram viewer window, with the exception of the menu option. When a position of interest is added, it is drawn as a red line outside of the cytogenetic banding circle.
Single chromosome viewer
As with the other windows, the Single Chromosome viewer window doesn't contain any patient specific data just the ideogram of chromosome 1 when it first appears with the regions data added as the genotype data is processed (Figure 8). Like the Linear Ideogram viewer window, autozygous regions are shown as thick lines, below the ideogram of the currently selected chromosome. The chromosome is selected using the drop down list at the bottom right of the window.
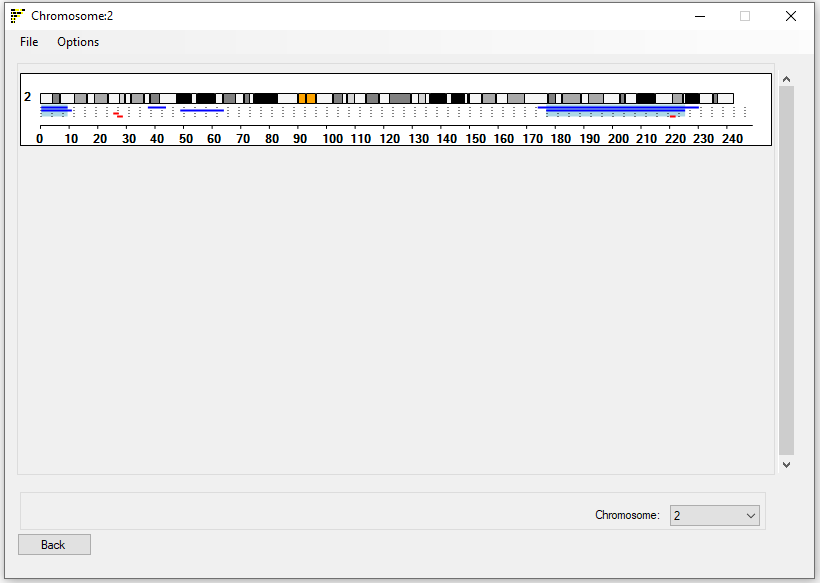
Figure 8: Exporting and customizing the display image
: This window contains the same menu structure as the Linear Ideogram viewer window, except of the inclusion of 5 menu options (figure 9):
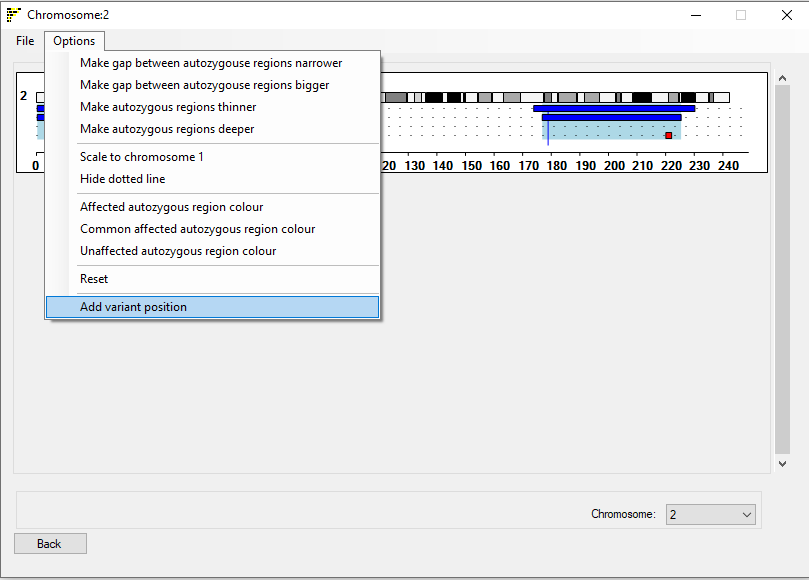
Figure 9: Completed analysis, showing the display of autozygous regions in affected (blue) and unaffected (red) subjects
The menu contains 5 new extra options:
The and menu options increase and
decrease the gap between the consecutive individuals.
The and menu options increase and decrease the thickness of the
blocks used to show the extent of the autozygous regions.
The menu option sets whether the selected chromosome spans the entire image or is drawn to the same scale as chromosome 1 would be.